Maximizing Revenue: The Role of KPIs in a Revenue Cycle Dashboard
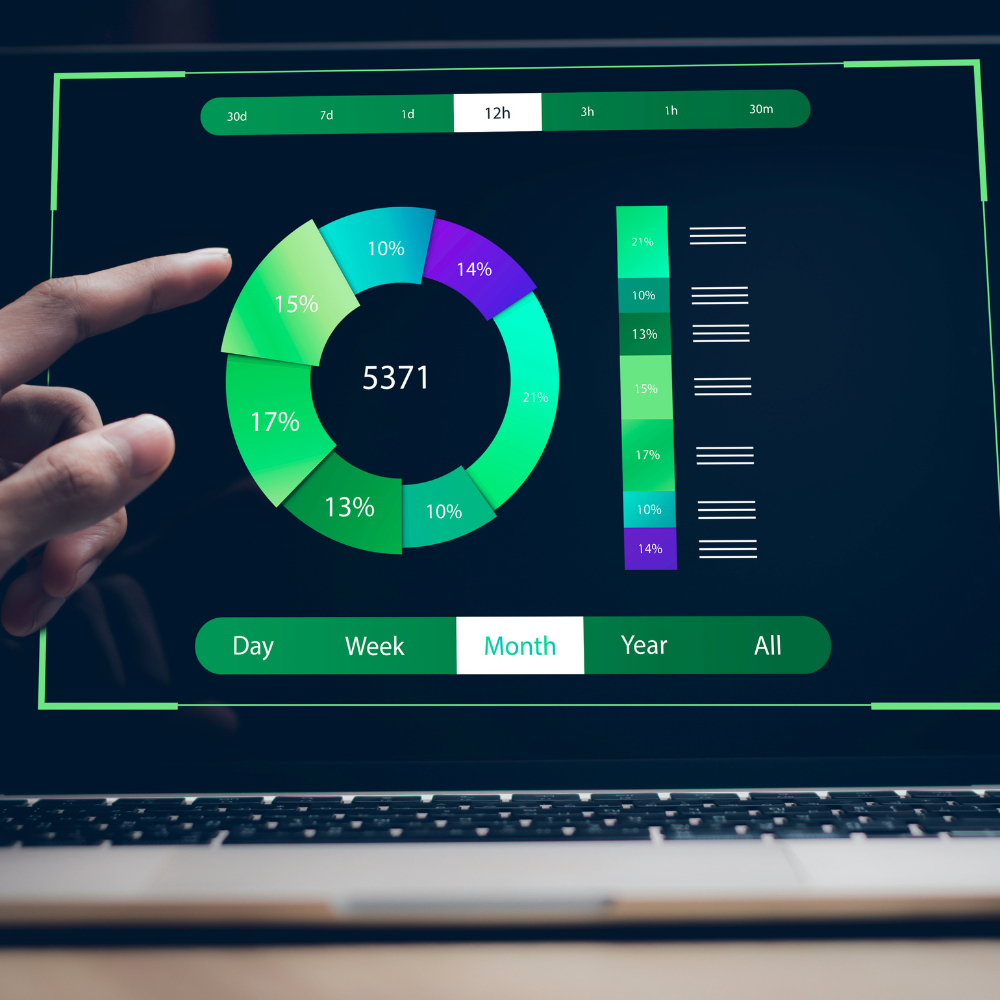
In today's competitive business environment, managing revenue effectively is crucial for the financial health of any organization. A revenue cycle dashboard provides a comprehensive view of key performance indicators (KPIs) that help monitor and improve the revenue generation process. By tracking and analyzing these KPIs, businesses can identify areas for improvement and make informed decisions to optimize their revenue cycle. In this blog post, we'll explore the use of KPIs in a revenue cycle dashboard and how they can help organizations maximize revenue.
Accounts Receivable Turnover (ART):
Accounts Receivable Turnover (ART) is a critical KPI that measures how efficiently a company is managing its accounts receivable. It is calculated by dividing net credit sales by the average accounts receivable balance. A high ART ratio indicates that a company is collecting payments from customers quickly, which is essential for maintaining a healthy cash flow. Monitoring ART helps identify potential issues with credit policies, collection processes, or customer payment patterns, allowing businesses to take corrective action to improve cash flow and reduce bad debt.
Days Sales Outstanding (DSO):
Days Sales Outstanding (DSO) is another important KPI that measures the average number of days it takes for a company to collect payment after a sale is made. A high DSO indicates that a company is taking longer to collect payments, which can negatively impact cash flow and liquidity. By monitoring DSO, businesses can identify inefficiencies in their accounts receivable process and implement strategies to shorten the collection cycle, such as offering discounts for early payment or improving invoice accuracy and timeliness.
Revenue Growth Rate:
Revenue Growth Rate is a KPI that measures the percentage increase in revenue over a specific period, usually year-over-year. Monitoring revenue growth rate helps businesses track the effectiveness of their sales and marketing efforts and identify trends in customer demand. A declining revenue growth rate may indicate a need for new product development or marketing strategies to stimulate sales growth. By analyzing revenue growth rate, businesses can make informed decisions to drive revenue growth and stay competitive in the market.
Gross Profit Margin:
Gross Profit Margin is a KPI that measures the percentage of revenue that exceeds the cost of goods sold (COGS). It indicates how efficiently a company is producing and selling its products or services. A high gross profit margin indicates that a company is generating more profit from each sale, while a low margin may indicate inefficiencies in production or pricing strategies. Monitoring gross profit margin helps businesses optimize their pricing, production, and operational strategies to maximize profitability.
Collection Effectiveness Index (CEI):
Collection Effectiveness Index (CEI) is a KPI that measures the effectiveness of a company's accounts receivable collection efforts. It is calculated by dividing the total amount collected by the total amount of outstanding accounts receivable, multiplied by the number of days in the period. A high CEI indicates that a company is effectively collecting payments from customers, while a low CEI may indicate inefficiencies in the collection process. Monitoring CEI helps businesses identify areas for improvement in their collection practices and improve cash flow.
Conclusion
A revenue cycle dashboard that incorporates these KPIs provides valuable insights into the efficiency and effectiveness of an organization's revenue generation process. By monitoring and analyzing these KPIs, businesses can identify trends, track performance, and make data-driven decisions to optimize their revenue cycle. Utilizing a revenue cycle dashboard helps businesses maximize revenue, improve cash flow, and achieve long-term financial success.


